3.流域区分と河川網の検出
4.同様だが,平面直角座標系の2mメッシュレーザースキャン
DEMを表示して,ある場所の断面図が必要な場合がある。その手順を述べる。
1.
rasterの10m mesh demを指定して,Map Displayに表示する。
2.
Map Displayのzoom optionsのzoom to computational region (Set with g.region) を選ぶ。
3. そして,Zoom inアイコンをクリックするとマウスの先が十字形になる。画像上で矩形を作って
中央をクリックする。ファイルが大きい場合,時間がかかる。
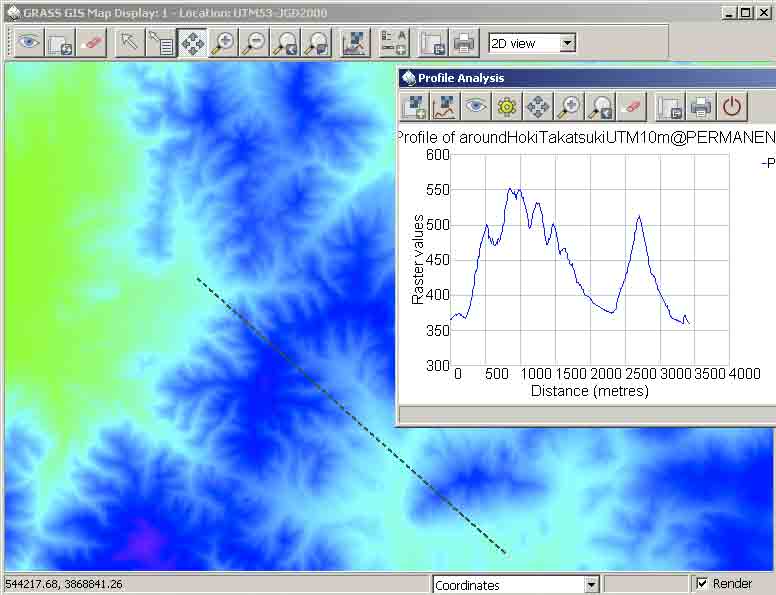
4. Analyzeアイコンをクリックして,Profile surface mapを選ぶ。二つのウィンドウが現れる。一つはファイル選択の,もう一つは断面図表示のための。
5. 後者のウィンドの左から二番目のグラフが描かれたアイコンをクリックするとマウスの先が十字形になる。それで断面位置を,クリックドラッグして離すと地図上に破線が描かれる。
6. グラフ表示ウィンドウの左から三番目のおめめのアイコンをクリックすると断面図が表示される。次の図を参照。グラフ上で,マウスの先は十字形になっており,クリックするとその (x, y)値が最下段に表示される。

このウィンドウの右端のプリンタの左隣のアイコンは,Save display to graphic file。これをクリックして,デスクトップなどにbmpなどの画像ファイルとして出力する。
2.1 表示
r.slope.aspectコマンドについて,Grassのhelpを確認すること。Windows版がうまくいく。Mac版にはこの計算については問題あり。Grass 6.4.2では問題が無くなった。この種の計算をするには対象マップのリージョン設定を必ずすること。解像度も使用DEMに合わせること。
gismoで,Raster/Terrain analysis/Slope and Aspect/のパネルで,Settingタブでdegrees,Outpusタブでoutputファイルは,それぞれ,slope, aspectを実行する。slopeやaspectの作成目的などが明確になったらソースのdemや目的などもファイル名に書いた方がいい。
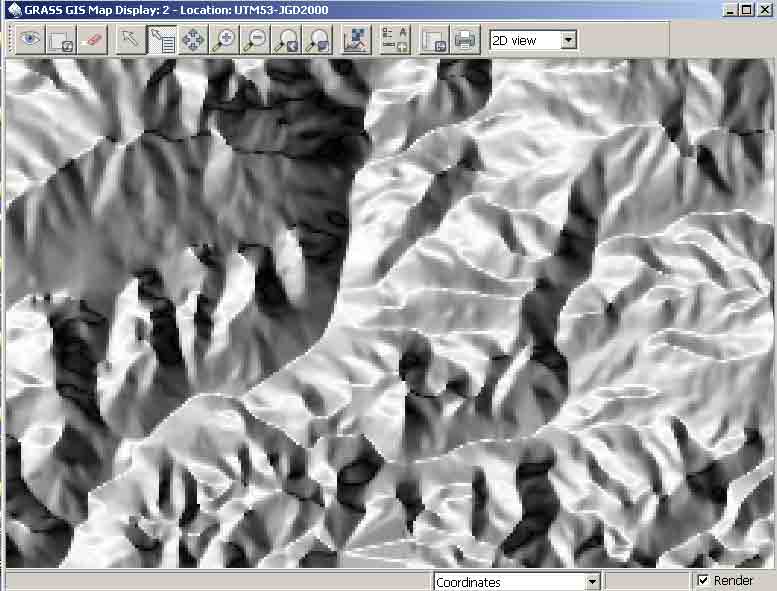
いずれも表示して,Map Displayの矢印アイコンの隣のqueryアイコンをクリックして,地図上をクリックすると,(x, y)座標値とともに,slopeなら傾斜角度,aspectなら真東向きを360度として,反時計回り(ccw)の斜面の向きを表示する。
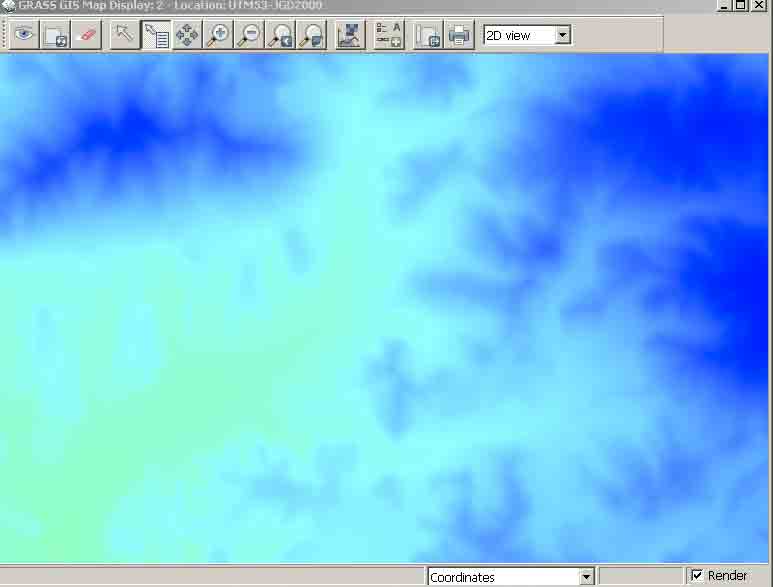
同じ場所での高度段彩図,slope図,aspect図を比較して,特にaspect図の意味するところを考えてみよう。
高度段彩図
slope図
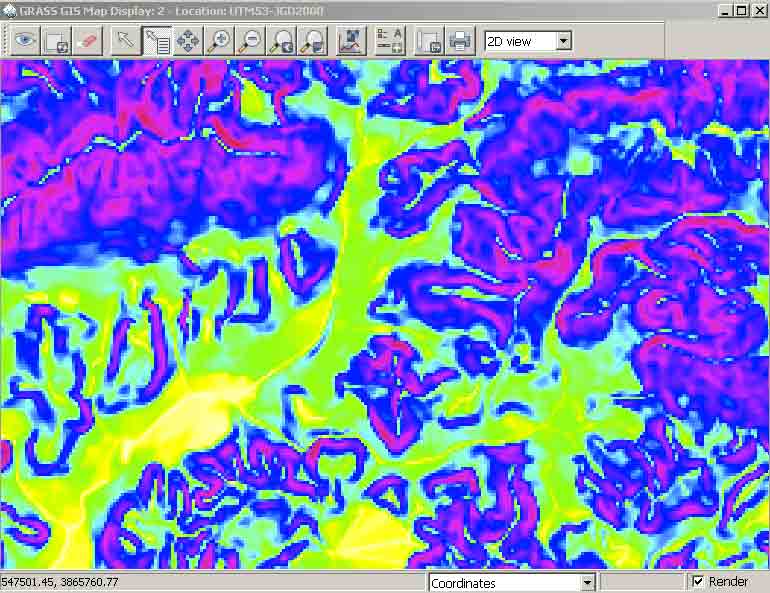
aspect図
2.2 意味
かんがえときます。
傾斜の最小値を決めないと低地部で現実感がなくなる。 基本的に5d以下は省略すること。
傾斜の最小値はtan5d=8.7%Grass tutorialのCreation of slope and aspect maps参照
Grass 6.4.2では問題が無くなった。この種の計算をするには対象マップのリージョン設定を必ずすること。解像度も使用DEMに合わせること。
モジュール r.watershed
http://grass.osgeo.org/grass70/manuals/html70_user/r.watershed.html
r.watershed [-s4mab] elevation=name [depression=name] [flow=name] [disturbed_land=name] [blocking=name] [threshold=integer] [max_slope_length=float] [accumulation=name] [drainage=name] [basin=name] [stream=name] [half_basin=name] [length_slope=name] [slope_steepness=name] [convergence=integer] [memory=integer] [--overwrite] [--verbose] [--quiet]
DESCRIPTION: r.watershed generates , 追加using a dem raster, a set of maps indicating: 1) flow accumulation, drainage direction, the location of streams and watershed basins, and 2) the LS and S factors of the Revised Universal Soil Loss Equation (RUSLE).
易しく解説:Grass Tutorial http://www.ing.unitn.it/~grass/docs/tutorial_62_en/htdocs/esercitazione/dtm/dtm4.html aroundHokiTakatsuki_UTM10mのdemに対して,ここに紹介されている方法をつかって実行しなさい。ただし,以下はこのサイトに記載されている内容を検証しながら実行している。
3.1 the r.watershed (Raster -> Hydrologic modeling -> Watershed analysis) moduleを実行。
3.1.1 optionsタブで,次のものにチェック。
Enable MFD flow (default is SFD (D8)) SFD(Single flow direction)は流下方向を8方位に限定。MFD(Multiple flow direction)では限定しない。
Convergence factorのdefault値は5。Convergence factor for MFD (1-10) 1 = most diverging flow, 10 = most converging flow. Recommended: 5 Default: 5
Maximum memoryはpcによるがここでは1000MBとする。Allow overwriteとする。
3.1.2 input optionsタブで,
aroundHokiTakatsuki_UTM10mを選ぶ。
input value: minimum size of exterior watershed basin (threshold: integer, optional)では10000(m2単位?)とする。これは,the minimum area of a sub basin で,これによって,流域区分の面積オーダーを決めることができる。1000が妥当かもしれない。
input value: maximum length of surface flow, for USLE(Universal Soil Loss Equation)この使い方は不明だがこれを限定するのは特殊な目的のためだろう。
3.1.3 output optionsタブで,
Output map :number of cells that drain thru each cellでは,accumulation10m
Output map: unique label for each watershed basinでは,basins10m
3.2 実行
私の環境ではほぼ1分間。
r.watershed elevation="aroundHokiTakatsuki_UTM10m@PERMANENT" accumulation="accumulation10m" basin="basins10m" threshold=10000 convergence=5 memory=1000
g.listでみると,
raster files available in mapset <PERMANENT>:
accumulation10m basins10m aroundHokiTakatsuki_UTM10m
3.3 basins10m threshold 10000を表示
Map Displayのqueryアイコン(r.what)を選んで,小流域のラベル番号がその範囲内で同一,他と異なることを確認する。
これは10mメッシュ全域を表示。
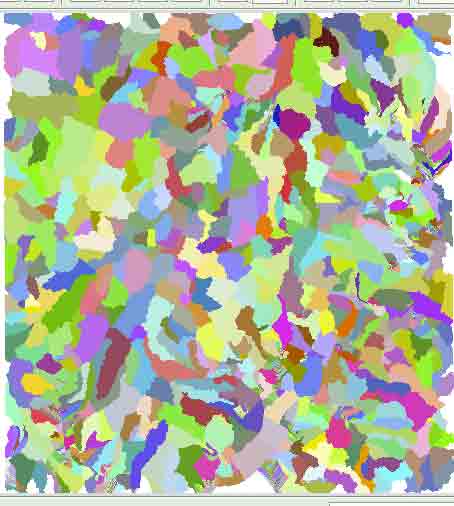
3.4 流域のカラー変更
the r.colors module (Raster -> Manage map colors -> Set colors to predefined color tables
rainbowカラーにして,再表示(全域)する。大きな流域区分が可能になったように見える。

3.5 Basemapをaspect,drapemapをbasinに
aspectを作成していない場合,Raster/Terrain Analysis/slope and aspectを実行する。ついでにslopeも作成する。なお,Mac版ではこの実行がうまく行かない。この命令はr.mapcalcを使う部分がある。Windows版で実施。2分ほど必要だった。
Basemapをaspect,drapemapをbasinに。全域表示。
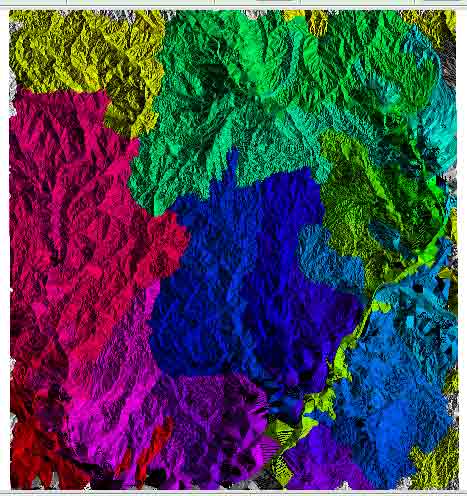
3.6 河川ネットワーク抽出
この作業でr.mapcalcを使うため,Windowsで実施する。さて,accumulation図の一部を次ぎに示す。
accumulation図は水流の頻度分布から河道を表示するのであるが,水系がみにくい。
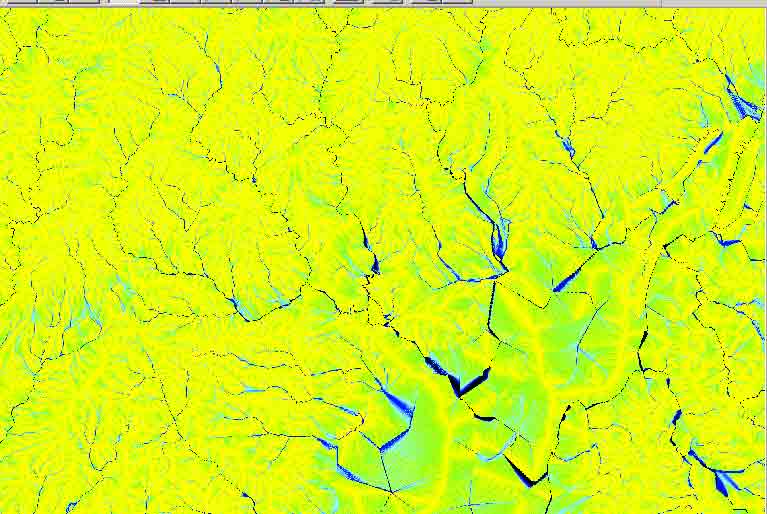
3.6.1 対数化
r.mapcalc 'log_accumulation10m=log(abs(accumulation10m)+1)'
ここで,logの真数は正でなければならず,abs(accumulation10m)はゼロの場合があるので1を追加している。対数値とすることで水文学的に意味のあるパラメータが得られる。
gis.mではRaster/Raster map calculator/を利用する。
(Mon Dec 13 00:48:18 2010)
r.mapcalc log_accumulation10m = log(abs(aroundHokiTakatsuki_UTM10m@PERMANENT)+1)
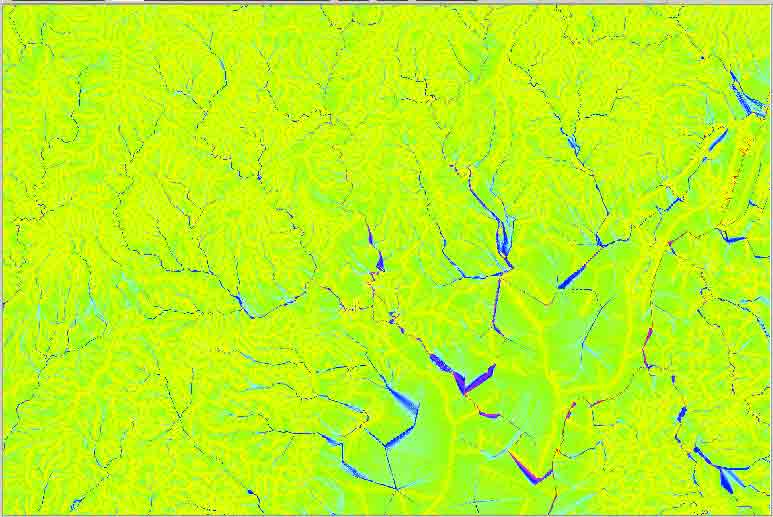
3.6.2 閾値で河道の抽出
いい閾値はデータによって変わる。tutorの例では6である。queryでチェックが可能ではあるが連続的に見ることができない。目的は谷筋とそれ以外の場所(セル)の数値の違いを明らかにして境界値を決めることである,これには,MapDisplayで複数のプロファイルを取るのがいいだろう。
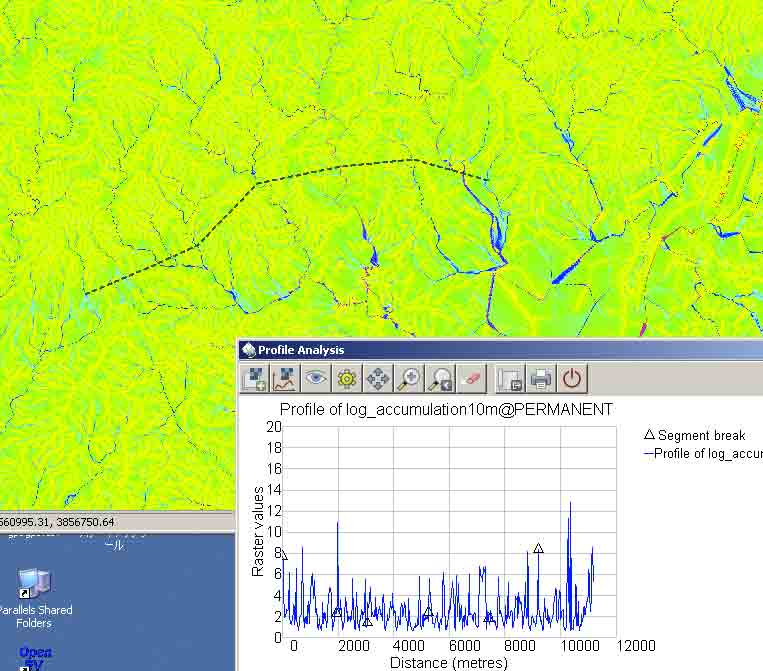
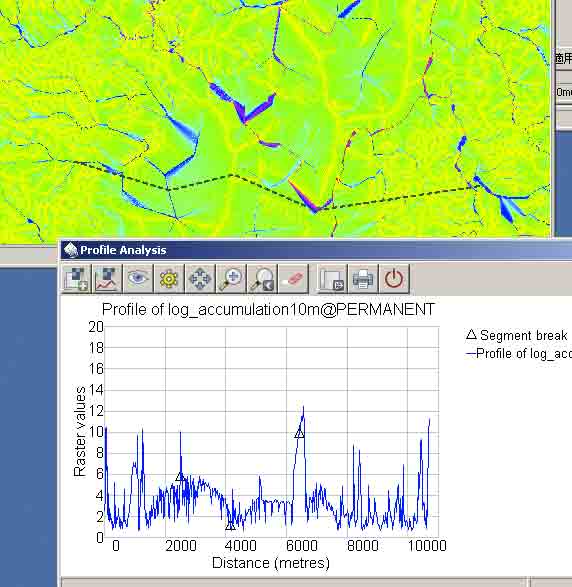
上図2枚のグラフに見える△は,ドラッグそしてクリックした地点である。
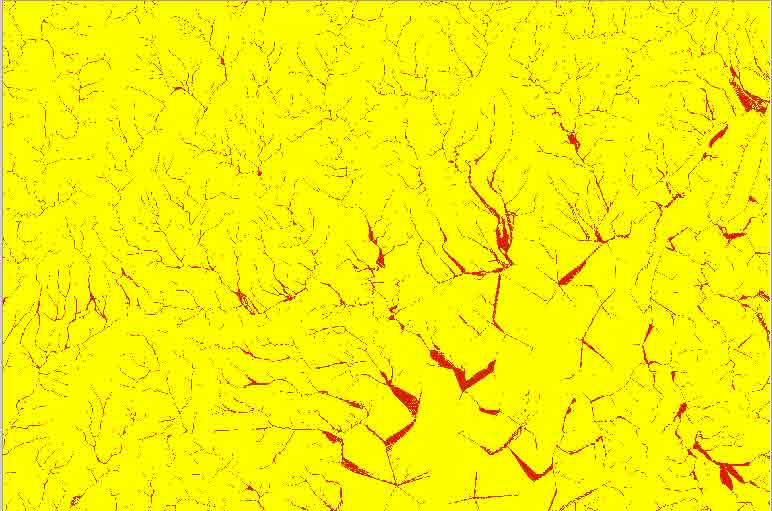
下に示した図のうち,上の方で判断するのは難しい。下の方では6というのはいい閾値のように見える。結果的には推奨値を利用する。ただ,目的によってはより低い値を取る場合が考えられる。
> r.mapcalc 'thr6_rivers=if(log_accumulation10m>6)'
3.7. 河川ネットワークのベクトル化
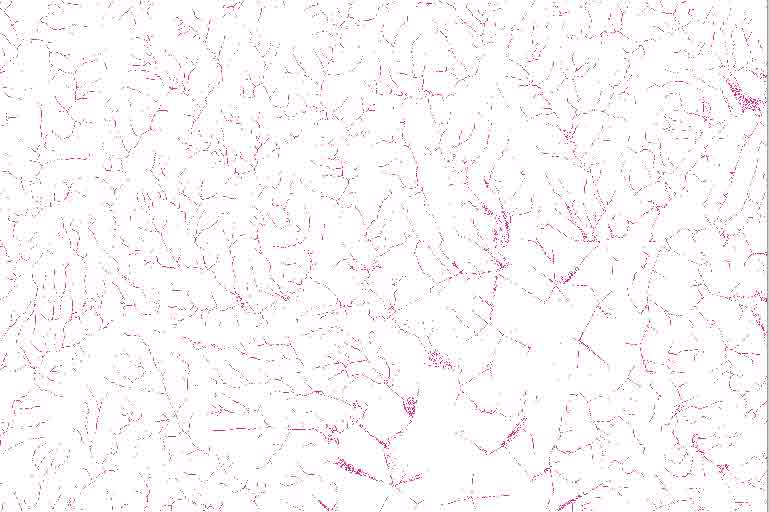
3.7.1 ベクトル化を実施する前に,線状構造を1ピクセル幅にしなければならない。
r.thin(Raster/Transform features/Thin linear features)を実施する。ただ,Windows版(少なくともぼくの環境では)では,gis.mで動かないので,コマンドベースで実施する。
http://grass.fbk.eu/grass62/manuals/html62_user/r.thin.html
で,r.thin input=name output=name [iterations=integer] [--overwrite]
iterationsはdefault値が200なので追加は不要だろう。
ここでは,
r.thin input=thr6_rivers@PERMANENT output=thin_rivers@PERMANENTとする。
3.7.2 ベクトル化
r.to.vect(File/Map type conversiongs/Raster to vector map)を使う。ただ,Windows版(少なくともぼくの環境では)では,gis.mで動かないので,コマンドベースで実施する。
http://grass.fbk.eu/grass62/manuals/html62_user/r.to.vect.html
r.to.vect [-svzbq] input=string output=name feature=string [--overwrite]
Flags:
-s
Smooth corners of area features
-v
Use raster values as categories instead of unique sequence (CELL only)
-z
Write raster values as z coordinate. Table is not created. Currently supported only for points
-b
Do not build vector topology (use with care for massive point export)
-q
Quiet - Do not show progress
--overwrite
Force overwrite of output files
Parameters:
input=string
raster input file
output=name
Name for output vector map
feature=string
Feature type
Options: point,line,area
Default: line
DESCRIPTION Lines
r.thin and r.to.vect may create excessive nodes at every junction, and may create small spurs or "dangling lines" during the thinning and vectorization process. These excessive nodes and spurs may be removed using v.clean.
featureのdefaultがlineなので特に入力しない。
r.to.vect input=thin_rivers@PERMANENT output=rivers --overwrite
数分必要である。outputのファイル名に@PERMANENTを入れると,出力されるベクトルファイルの名がriversPERMANENTになってしまう。
なお,上記のdescriptionに従えば,v.cleanが必要であるが,河川網についてはすべきでない。下記にv.cleanの説明がある。
http://grass.fbk.eu/grass62/manuals/html62_user/v.clean.html
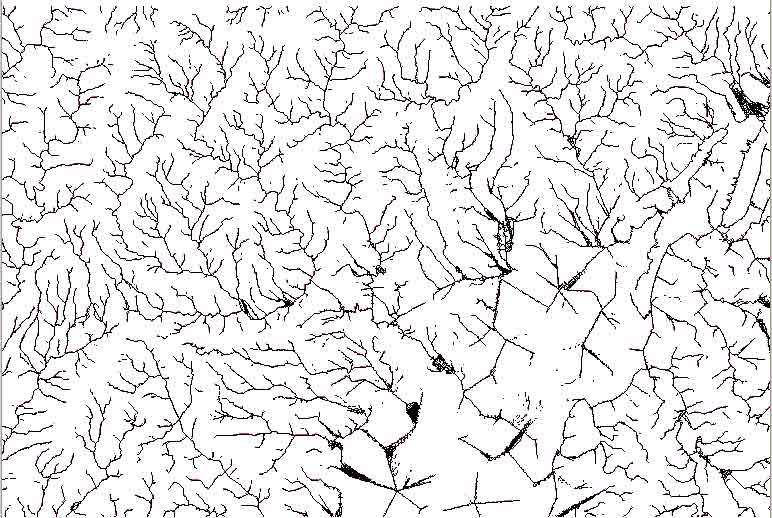
3.7.3 ゴミの削除
tutorでは上下にゴミが出てその削除法が示されている。このツールの使用法を知る上で参考になろう。ただ,ここではtutorにあるようなゴミはなかった。
3.8. 流域図に河川網を載せる
ベクトルファイルriversをラスターファイルbasins10mよりも上の行に置く。
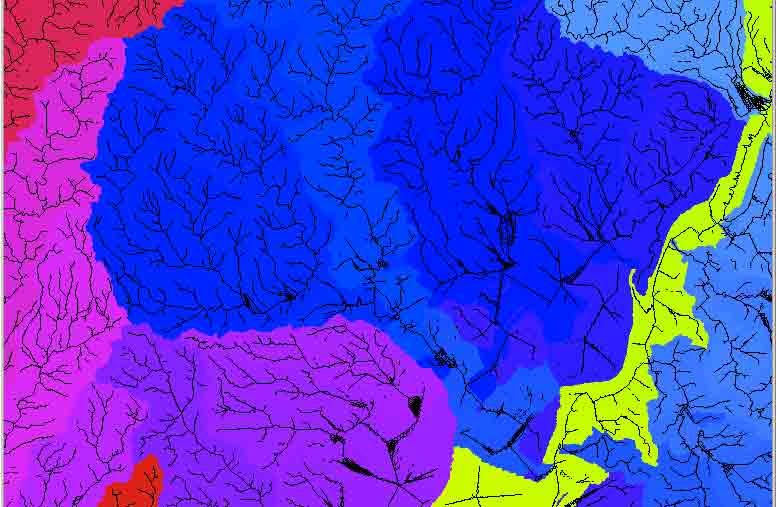
これでは見にくい。riversをダブルクリックするとパネルが表示される。色を選んでwhite,ラインを選んで線幅を1とする。
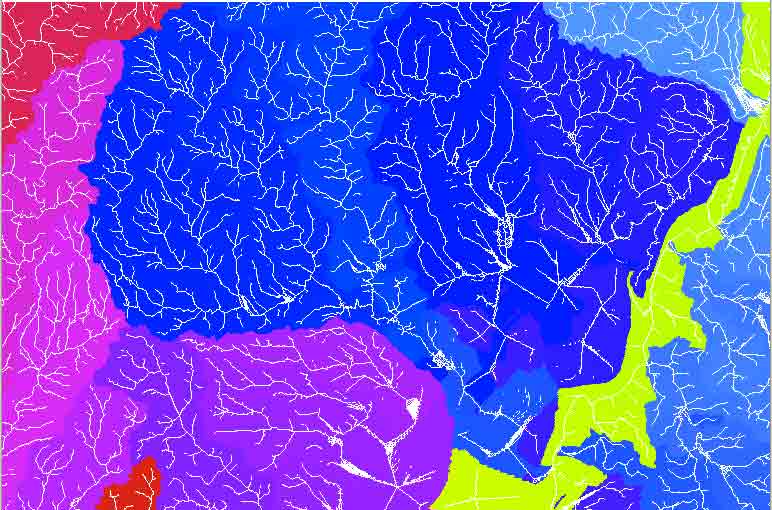
3.9 他の選択
これまでの作業で複数の選択肢があった。tutorでは元になったdemの解像度を変えることでどのように変化するのかを実験してみるよう提案している。
色調の調整などは出力した後にPhotoshopやGIMPなどで実施するよりも,できればGrass内でColor機能を使った方が簡便である。
ここでは上記と同様の目的で実施したが,少し角度を変えて実施したので,参考に示す。
4.1 r.watershed: 2mDEMを使って
http://grass.fbk.eu/grass62/manuals/html62_user/r.watershed.html
r.watershed generates a set of maps indicating: 1) the location of watershed basins, and 2) the LS and S factors of the Revised Universal Soil Loss Equation (RUSLE).
ここのNotesにはr.terraflow(ArcGISと同じアルゴリズムが使用されている)に比べて,r.watershedが優れていることが示されている。r.watershedは低地の流域そして流路区分にも強いようである。
r.watershed -f elevation=IbarakiSouth_2m_totaldem@PERMANENT accumulation=accumulation2m basin=basins2m stream=streamsegments2m half.basin=halfbasins2m visual=watershedBasins_visual2m threshold=2500 convergence=5 memory=1000 --overwrite
完了
この実行で注意すべきことは, threshold=2500である。これは必須である。minimum size of exterior watershed basinは,ある地域をどこまで細分するのかということである。cell数で表す。この例での解像度は2mである。100m四方つまり1haという小さい単位までの小流域を捉えてみよう。100m/2m=50cellsだから2500 (cells)を入力すればいい。
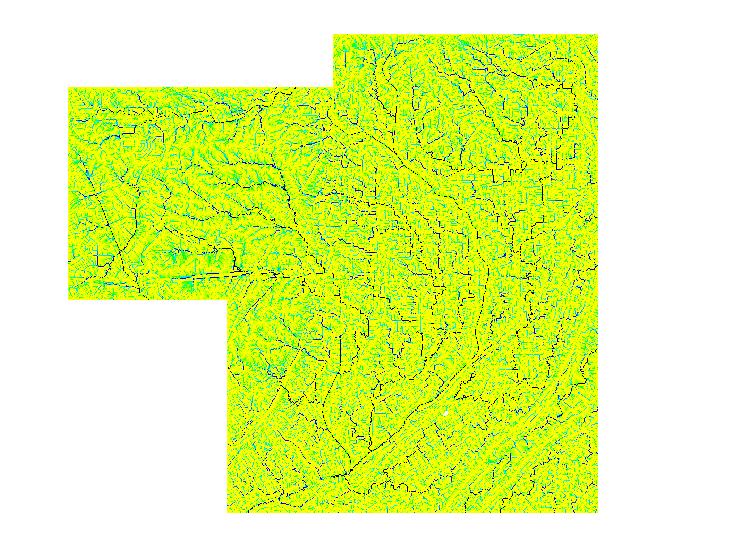
得られたファイルをGrassで表示しjpg出力したものを次ぎに示す。
accumulation=string
Output map: number of cells that drain through each cell いわば流量
The absolute value of each cell in this output map layer is the amount of overland flow that traverses the cell. This value will be the number of upland cells plus one if no overland flow map is given. If the overland flow map is given, the value will be in overland flow units. Negative numbers indicate that those cells possibly have surface runoff from outside of the current geographic region. Thus, any cells with negative values cannot have their surface runoff and sedimentation yields calculated accurately.
basin=string
Output map: unique label for each watershed basin 各小流域のラベル
Unique label for each watershed basin. Each basin will be given a unique positive even integer. Areas along edges may not be large enough to create an exterior watershed basin. 0 values indicate that the cell is not part of a complete watershed basin in the current geographic region.
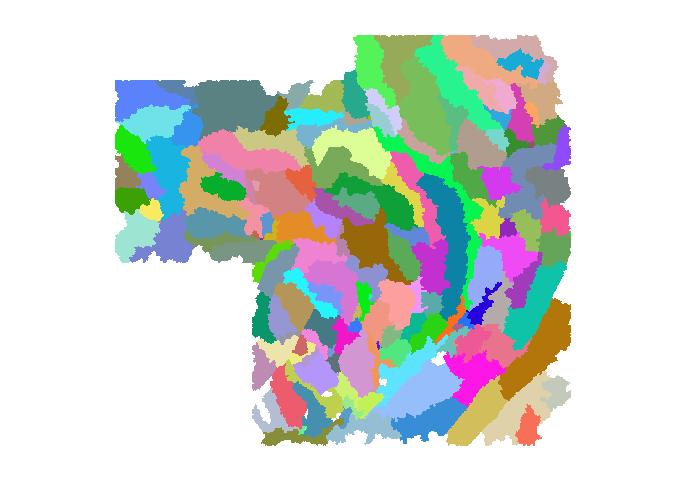
stream=string
Output map: stream segments 水系の次数を見るのにいいが,ラベルは次数ではなく,水流が流れている小流域と同ラベルが付加されている。
Values correspond to the watershed basin values.
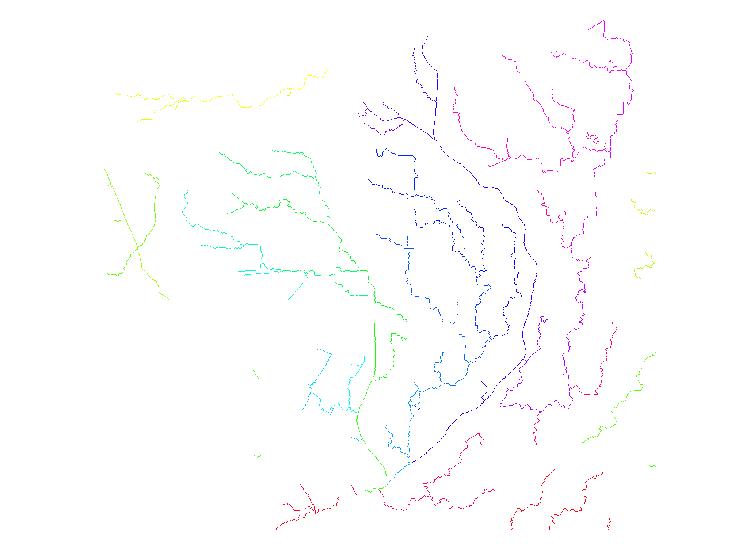
half.basin
Output map: each half-basin is given a unique value. 個々の小流域について,上流側に向かって主要流の右側には同小流域のラベル名(偶数)が,左側にはその値から1差し引いたラベル名(奇数)が付加されている。
Watershed basins are divided into left and right sides. The right-hand side cell of the watershed basin (looking upstream) are given even values corresponding to the values in basin. The left-hand side cells of the watershed basin are given odd values which are one less than the value of the watershed basin.
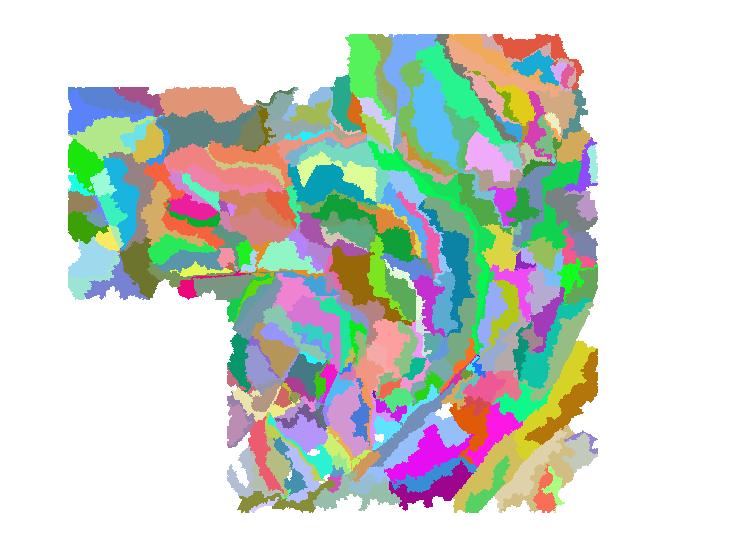
visual=string
Output map: useful for visual display of results ここに示したように流れを留める可能性がある道路などは明瞭に示されている。accumulationすなわち流量がマイナス値を示すセルは全てゼロにセットされている。ここではbasin threshold値は2500 (50 cells x 50 cells,つまり面積にして1ha)であるが,1haを越える小流域について正の値が配分されている。要するにaccumulation mapを簡略化して認知しやすくしたものである。
Surface runoff accumulation with the values modified to provide for easy display. All negative accumulation values are changed to zero. All positive values above the basin threshold are given the value of the threshold parameter.
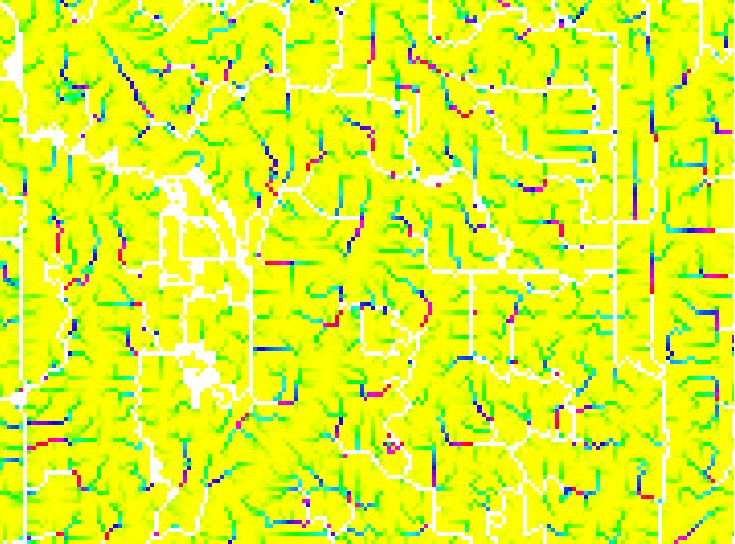
で,ベクトル化を実施する。
#Convert the steams and catchments to vectors
gis.mでは,Files/Map type conversions/Raster to vector/
r.to.vect input=basins2m@PERMANENT output=basins2m_vect feature=area --overwrite
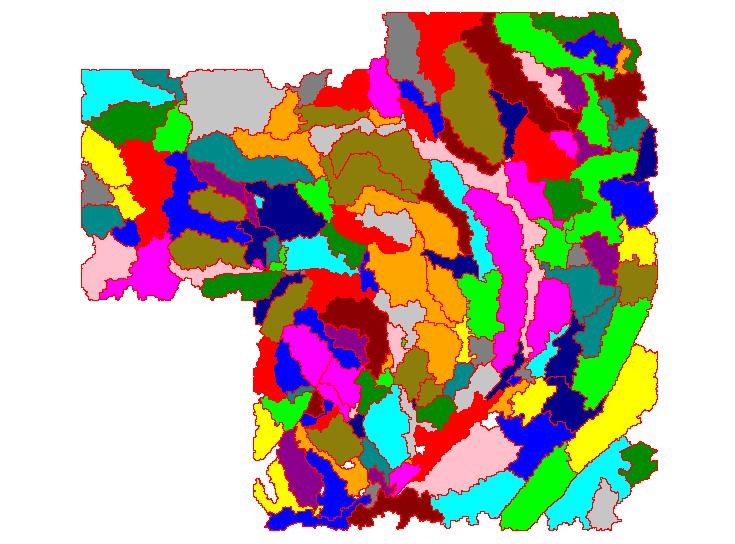
# the stream raster usually requires thinning
gis.mでは,raster/transform features/thin/から。Maximal number of iterationsの数はデフォルトの200のまま。
r.thin input=streamsegments2m@PERMANENT output=streamsegments2m_thin iterations=200 --overwrite

gis.mでは,Files/Map type conversions/Raster to vector/
r.to.vect input=streamsegments2m_thin@PERMANENT output=streamsegments2m_vect feature=line --overwrite
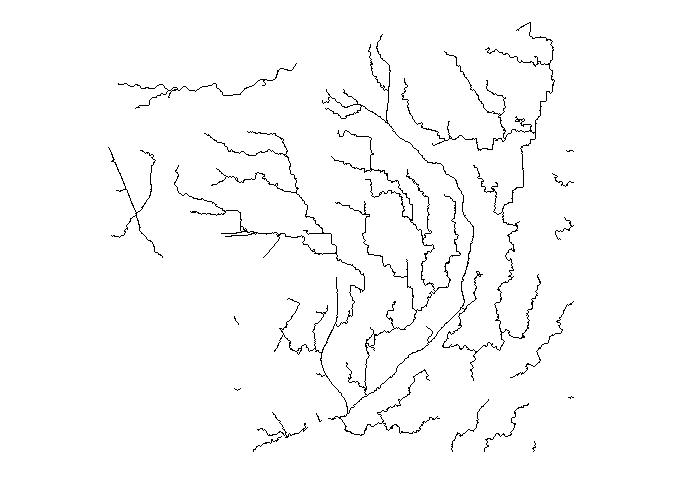
# Make a hillshade raster for displaying "3D"
DEMから陰影図を作る。
http://grass.fbk.eu/grass62/manuals/html62_user/r.shaded.relief.html
参照。
altitude=float Altitude of the sun in degrees above the horizon
Options: 0-90 Default: 30
azimuth=float Azimuth of the sun in degrees to the east of north
Options: 0-360 Default: 270
zmult=float Factor for exaggerating relief
Default: 1
scale=float Scale factor for converting horizontal units to elevation units
Default: 1
units=string Set scaling factor (applies to lat./long. locations only, none: scale=1)
Options: none,meters,feet Default: none
gismoでは,Raster/terrain analysis/shaded relief/
r.shaded.relief map=IbarakiSouth_2m_totaldem@PERMANENT shadedmap=IbarakiSouth_2m_totaldem_shade altitude=30 azimuth=270 zmult=4 scale=1 units=none --overwrite
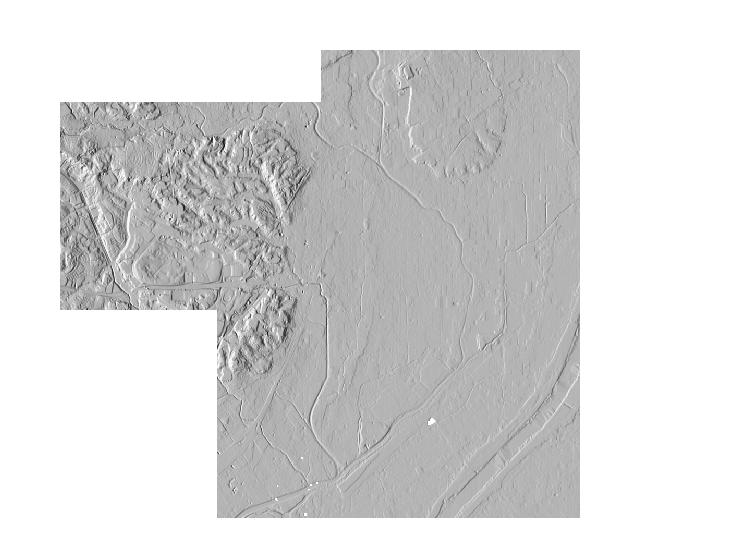
下記が必要かどうか。d.hisについては確認すること。d.vec roadsについてはすでにroadsが作成されていることが前提。さらにcolorについては別途検討すること。
国土情報基盤の茨木市付近をダウンロードすること。またはダウンロードしたものが何であるのかを確認すること。投影法は平面直角座標系であろう。
5. 演習
演習1 slopeとaspectの意味を知ろう
(この計算はすでに実施したことがあるので,実行は君たちが自分でやること)
0. 前もってデスクトップに作業用のフォルダ(eg. miffy)を作成すること。これ以降,作成するファイルをここに保存してゆくこと。
1. OSGeo4W/Grass GIS 6.4.0/wxPython 6.4.0を実行
2. Location: UTM座標系世界測地系大阪のゾーン, Mapset: PERMANENTを選ぶ。
3. 次のラスターマップ北摂山地周辺のラスターマップをMap Displayに表示する:aroundHokiTakatsukiUTM10m@PERMANENT
4. Graphic Fileとして保存しWordに取り込む。説明を入れる。
5. Map Displayで,距離感を掴むために,スケールと方位を入れる。
6. その上で3km四方ぐらいを地形が比較的によくわかる場所を選んで,zoom機能を使って,拡大する。
6' ファイル/ワークスペース/保存,でmiffyにeg. workspace1という名称で保存。
7. すでに表示されているのは,高度段彩図hypsometrical tint mapである。これにRaster/Terrain analysis/Slope and Aspect/のパネルを使って,slope図とaspect図を作りなさい。
ただし,それぞれで地形が明瞭な断面が得られると思われる場所で,分析アイコンをクリックして,断面図を作成しなさい。断面位置の長さは1kmぐらいが適当かと思われるが,場所によるであろう。
8. そして作成された3枚の地図(断面位置が示されている)とそれぞれの断面図をgraphic fileとして出力し,Wordに取り込んで,整理しなさい。
演習2 流域区分と河川網の意味を考えよう
(この計算は初めてなので,一緒にやってゆきます。ただし,場所は前の演習で君たちが独自に実施した範囲です)
1. 先の演習と同様,aroundHokiTakatsukiUTM10m@PERMANENTを使う。
2. スケールと方位を表示し,前の演習で選んだ範囲にzoom inすること。
2'. the r.watershed (Raster -> Hydrologic modeling -> Watershed analysis) moduleを実行。基本的にはすべてdefault値で。output optionタブではマップの名称を指定する必要がある。 Output map :number of cells that drain thru each cellでは,accumulation10m
Output map: unique label for each watershed basinでは,basins10m
に近い名称を使うこと。
3. 作成されたかどうか,g.listで確認すること。作成過程でgraphic fileを出力してゆくこと。
4. basins10m threshold 1000を表示する。Map Displayのqueryアイコン(r.what)を選んで,小流域のラベル番号がその範囲内で同一,他と異なることを確認する。
5. 流域のカラー変更を実施する。どういった色がいいのか各自確認すること。
6. Basemapをaspect,drapemapをbasinに。以下,このページの順序に従うが,作成過程を記録してゆくこと。
7. 最後にWordでまとめること。
演習 geotiffの作成
これは別のページを参照してほしい。
以上